Important things to know
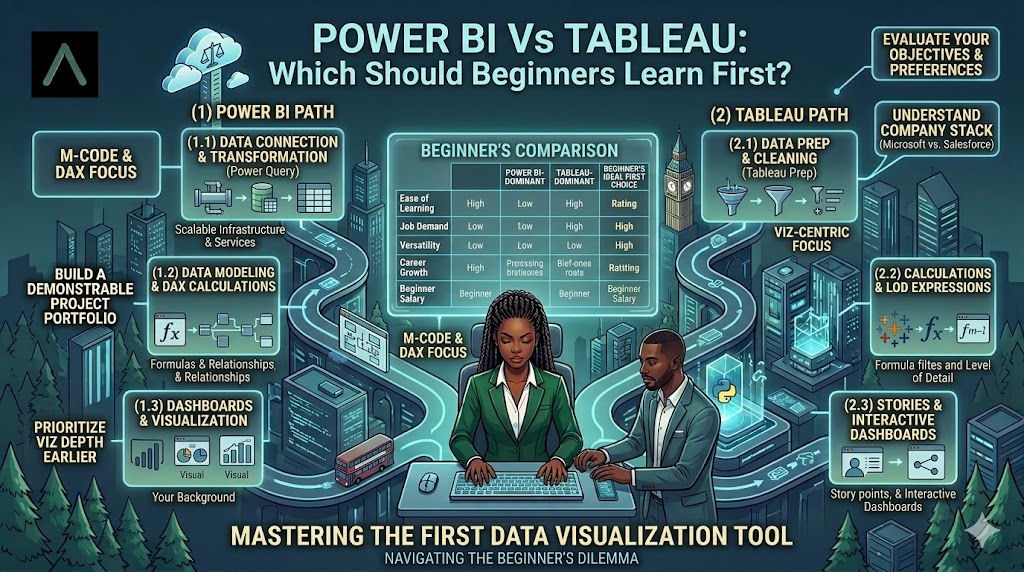
If you are starting a career in data analytics, you will quickly encounter two popular tools: Power BI and Tableau. Both tools are widely used for data visualization, reporting, and building dashboards. However, beginners often struggle with one simple question: Which tool should I learn first?
The truth is that both Power BI and Tableau are powerful Business Intelligence tools used by companies around the world. They help analysts transform raw data into meaningful insights through dashboards and visual reports. But for someone just beginning their analytics journey, choosing the right starting point can make the learning process smoother and more effective.
This guide will help you understand the key differences between Power BI and Tableau, their strengths, and which one may be the better choice for beginners in 2026.
1. Understanding What Power BI & Tableau Are:
Before deciding which tool to learn first, it is important to understand what each one does and why companies use them.
Both Power BI and Tableau belong to a category called Business Intelligence (BI) tools. These tools allow analysts to connect to data sources, clean data, analyze trends, and create visual dashboards that help businesses make better decisions.
Power BI
Power BI is a Business Intelligence tool developed by Microsoft. It integrates easily with other Microsoft products like Excel, SQL Server, and Azure. Many organizations already use Microsoft tools, which makes Power BI a natural choice for their analytics teams.
Tableau
Tableau is a powerful data visualization tool known for its advanced visual capabilities. It allows users to create interactive dashboards and visually explore large datasets. Tableau is widely used in industries that rely heavily on storytelling through data.
Both tools serve the same general purpose: turning data into insights. The difference lies in how they approach visualization, ease of use, and integration with other systems.
2. Ease of Learning for Beginners
One of the biggest concerns for beginners is how easy a tool is to learn. When you are just starting your data analytics journey, tools that feel intuitive and structured can make a big difference.
A. Power BI Learning Curve
Power BI is often considered beginner-friendly because its interface is similar to Excel and other Microsoft tools. If you already have experience with Excel formulas or pivot tables, learning Power BI can feel familiar.
Power BI also guides users through the process of importing data, transforming it, and creating visualizations.
Beginner Advantages of Power BI
● Familiar interface for Excel users
● Simple drag-and-drop dashboard creation
● Strong integration with Microsoft tools
● Large learning community and tutorials
B. Tableau Learning Curve
Tableau focuses heavily on visual exploration. It gives users a lot of flexibility when building dashboards, which can be powerful but sometimes overwhelming for beginners.
The interface is different from traditional spreadsheet tools, which means new learners may need extra time to understand how data fields and visualizations work together.
Beginner Challenges with Tableau
● Less familiar interface for spreadsheet users
● More flexibility which can increase complexity
● Slightly steeper learning curve for first-time analysts
“Beginners often find Power BI easier to start with, while Tableau rewards users who want deeper visualization control.”
3. Visualization & Dashboard Capabilities
Both tools are designed to create dashboards, but their strengths in visualization are slightly different.
A. Power BI Visualization Strengths
Power BI provides a wide range of standard visualizations such as bar charts, line charts, maps, and KPI indicators. These visuals are easy to configure and suitable for most business reporting tasks. Power BI also allows users to add custom visuals through its marketplace.
Key features include:
● Interactive dashboards with filters and slicers
● Built-in templates for reports
● Custom visual extensions
● Integration with Excel datasets
B. Tableau Visualization Strengths
Tableau is often praised for its advanced visualization capabilities. It allows analysts to build complex, highly customized visuals that help tell deeper stories with data. Many professional data storytellers prefer Tableau because of its design flexibility.
Key features include:
● Highly customizable visual dashboards
● Advanced data exploration tools
● Strong visual storytelling capabilities
● Smooth interaction between charts and datasets
Tableau is often considered the gold standard for advanced data visualization.
4. Industry Adoption & Job Market Demand
Another important factor for beginners is how widely a tool is used in the job market.
Many companies today rely on Business Intelligence tools for reporting and decision-making. Both Power BI and Tableau appear frequently in job descriptions for roles such as Data Analyst, Business Intelligence Analyst, and Reporting Analyst.
Power BI in the Job Market
Power BI has seen rapid growth because many organizations already use Microsoft systems. Companies prefer tools that integrate easily with their existing infrastructure.
Power BI is commonly used in:
● Finance and operations teams
● Corporate reporting environments
● Organizations using Microsoft ecosystems
Tableau in the Job Market
Tableau is widely used in technology companies, consulting firms, and organizations that focus heavily on data storytelling and visual analytics.
It is commonly found in:
● Data-focused organizations
● Consulting and analytics firms
● Product and marketing analytics teams
In many job markets today, learning Power BI first provides faster entry-level opportunities.
5. Cost & Accessibility
Cost can also influence which tool beginners choose to learn.
Power BI Pricing Advantage
Power BI offers a free desktop version that allows beginners to practice building dashboards and reports without paying for a license. This accessibility makes it very attractive for students and entry-level analysts.
NB: Organizations can later upgrade to paid versions for collaboration and cloud sharing.
Tableau Pricing Structure
Tableau also offers learning options, but the full professional version can be more expensive. While Tableau Public is available for practice, it has limitations compared to the professional software used by companies.
For beginners who want a low-cost entry point, Power BI often becomes the easier choice.
6. When It Makes to Learn Tableau First
Although Power BI is often recommended for beginners, there are situations where learning Tableau first may be beneficial.
You might choose Tableau first if:
● Your target industry heavily uses Tableau
● You are interested in advanced data storytelling
● You want deeper control over custom visualizations
● Your training program or course focuses on Tableau
Many analysts eventually learn both tools during their careers. Choosing one tool does not limit your future opportunities. The core skills transfer easily.
7. The Best Learning Strategy For Beginners
The most effective strategy is not to try mastering both tools at the same time. Instead, beginners should focus on one platform, build strong fundamentals, and then expand their skills later.
A simple learning roadmap looks like this:
- Learn basic data analysis concepts and business metrics.
- Choose one visualization tool to focus on first.
- Build practical dashboards using real datasets.
- Practice explaining insights through storytelling.
- Expand your toolkit once your fundamentals are strong.
If you are starting from scratch, Power BI often provides a smoother entry point. After gaining confidence, learning Tableau becomes much easier.
Both Power BI and Tableau are powerful tools that play a major role in modern data analytics. They help organizations transform raw data into meaningful insights that support better decisions. For beginners, Power BI is often the easiest starting point because of its familiar interface, strong Microsoft integration, and accessible pricing. Tableau, on the other hand, shines when it comes to advanced visualization and deeper data storytelling.
The most important thing to remember is that tools are only part of the analytics journey. Strong analytical thinking, problem-solving skills, and clear communication matter far more than the specific software you start with. Start by learning one tool deeply, build a few real dashboard projects, and practice explaining the insights you discover. Once your foundation is strong, learning additional tools like Tableau will become much easier. Find out about how our Data Analytics internship will help you gain experience and increase your chances of landing jobs. Click here to get started.